 Tuesday November 01, 2011
Tuesday November 01, 2011
Tuesday November 01, 2011
Host-based sFlow: a drop-in cloud-friendly monitoring standard

Everyone who is a professional sysadmin knows that part of the excitement and drain of our jobs, is keeping track of all the different technologies out there, how and what to add to our toolbox, and what's coming next.
Sometime we are lucky enough to bump into an old friend that has grown and matured over the years. I'm talking about technology, and in this case, sFlow. I used a number of Foundry (now Brocade) switches at different companies over the years and they all implemented sFlow. I would send all my sFlow data to various different collectors at different jobs, and was constantly amazed at the power and versatility of this technology.
One of the things in which sFlow really excels in the network space is doing things like showing you the "top talkers" on a network segment. It does this by sampling the packet stream and allowing you to see what it sees. This is much more efficient than trying to capture every packet. When you are able to adjust the amount of sampling you do based on the packet count you experience, you are able to handle much larger volumes of traffic with a high degree of confidence in your data. I always thought that it would be great if I could get this level of visibility on my application tier, and now I can.
The sFlow community has been making great strides with Host sFlow which takes some of the same great characteristics from the network sFlow standard and applies them on the host and application side. This means that you can actually find out which URLs are being hit the most, which memcache keys are the hottest, and how that correlates with what you are seeing on the network.
Setup
Setting up host-flow could not be much easier. First, you can download packages for FreeBSD, Linux, or Windows from the SourceForge Site. Once installed, when you start the daemon; on Linux, it will check /etc/hsflowd.conf to find out where the sFlow collector(s) are located. This is where the daemon will send all the data. You can also set things like polling and sampling rates in this file. If you wish, you may also define these using the location services in DNS. That's it.
You will also need a collector. The simplest collector is sflowtool which will capture the packets and present them to you in various formats all of which are consumable by your favorite scripting language. There are many collectors to choose from. At Tagged one of our favorite collectors is Ganglia!.
As of Ganglia 3.2, it can understand and process sFlow packets. At Tagged, we have replaced all of our gmond process with hsflowd.
Efficiency
One of the great things about replacing our gmond processes is that our monitoring infrastructure is now much more efficient. With gmond, every metric that you measure sends a packet across the wire. If you sample every 15 seconds, it simply sends a packet every 15 seconds, for each metric that you monitor. With hsflowd, you can sample every 15 seconds, but hsflowd will batch all those metrics up into a single packet and send those across the wire. We are actually able to collect more metrics, more often, with less packets. On a big network like Tagged, anything we can do to lower our packets per second is a big win. The difficult part was converting from multicast which a trivial setup to unicast. We took it as an opportunity to templatize all our puppet configs for this purpose based on our CMDB. Now we have a system that we really love.
A Standard, Really
Perhaps one of the things that was most challenging to wrap our heads around is that sFlow is not a replacement for our Ganglia or Graphite tools. sFlow is a standard on switches and it's a standard on the host side too. That does not mean that you cannot instrument your own applications with sFlow. It means that this is not the default configuration for sFlow. It means that if you are going to look at your HTTP metrics whether they come from Apache, Nginx, or Tomcat, they are going to be the same metrics.
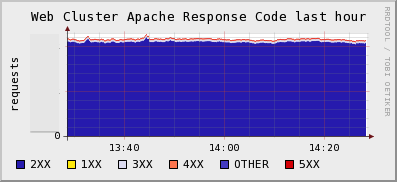
If you want to monitor things like the number of active users on your site, you can still do those things with gmetric or graphite. However if you want to be able to find out how many of your HTTP requests have 200, 300, or 500 response codes, and you want to be able to do that in real-time across a huge web farm ( which makes log analyzers and packet sniffers completely impractical) then you want mod-sflow (for Apache).
Solves The Java JMX Problem
There are a few other things that have me excited about sFlow. One, is that it solves the JVM monitoring problem. Ops folks always want to know how their Tomcat or JBoss servers are running. You can buy fancy tools from Oracle to do this, or you can use the jmx-sflow-agent. Typically, the way we solve this problem is that we either fire up a tool like check_jmx which basically fires up a JVM each and every time it needs to check a metric *shudder*, or we run a long running java process that we need to constantly update with a list of servers to poll in order to get graphs of our heap sizes.
Alternatively you could run jmx-flow-agent which runs as a -javaagent argument to the jvm command line and have all your JVMs automatically send their metrics to a central location the moment they start.
Cloud-Friendly
That's the thing. When applications start up, they start sending their data via sFlow to a central location for you. There is no polling. This is the same model as all the next generation of monitoring tools like Ganglia and Graphite. This is cloud-friendly.
Imagine you were Netflix running thousands of instances on EC2. Would you rather have to update your config file every few seconds to make your monitoring systems aware of all the hosts that have been provisioned or destroyed, or would you like new hosts to just appear on your monitoring systems as the hosts appear? At Tagged, we would be constantly updating our config files every time a disk failed, or when a tier was expanded or a new one provisioned. We would have to specify in the file, which hosts were running Java, or Memcache or Apache, or both.
Instead, in our world, if an application is running on a host, we see that application in our monitoring tools, instantly. Deploying mod-sflow to your apache servers was as simple as creating an RPM and putting a few lines in Puppet. Awesome.
The Future
sFlow's relationship with the host side of the equation is just picking up steam now. We've been lucky enough to be at the leading edge of this, mostly through my giving my LSPE Meetup Talk at on the right day, at the right time. In the coming weeks, we hope to share more with the world what we're getting from using sFlow on our network, why we are loving it, and what problems it's helped us to solve.
Posted by Dave Mangot in Applications at 20111101 Comments[2]Search This Site
Recent Entries
- DevOpsDays 2012: "Event Detection" Open Space
- DevOpsDays 2012: "Logging" Open Space
- Ode to the External Node Classifier (ENC)
- I'm speaking at Velocity 2012!
- Host-based sFlow: a drop-in cloud-friendly monitoring standard
- Graphite as presented to the LSPE Meetup 16 June 2011
- The Graphite CLI
- Back on the Blog Gang
- A framework for running anything on EC2: Terracotta tests on the Cloud - Part 1
- A Trade Show Booth: Part 2 - The Puppet Config
- Intstalling Fedora 10 on a Mac Mini
- A Trade Show booth with PF and OpenBSD
- EC2 Variability: The numbers revealed
- Linksys WET54G, a consumer product?
- Choosing Zimbra as told to ex-Taosers@groups.yahoo
- Information Security Magazine Chuckle
- A SysAdmin's impressions of MacOS Leopard
- Worlds collide: RMI vs. Linux localhost
- Hello World
Hi,
Thanks for the post, this looks very interesting. Are you able to post a bit more about your config, especially how you have configured ganglia to handle the output from mod-sflow? Are you using rrdtool at all, or is your backend for this entirely graphite? Keenly awaiting any more info you wish to provide.
Posted by Michael on November 01, 2011 at 04:54 PM PDT #
Michael,
Thanks for your comment. I will definitely be posting more about our config. We are using rrdtool with Ganglia but sending the data to graphite is certainly an option for us. We would need to write something that consumed the data stream from sflowtool and sent it to Graphite.
Our Ganglia instance is patched to handle the mod_sflow packet natively. I think the patches are available by request until things settle down with the new sFlow standards. If you're interested, I'd ask on the host-sflow-discuss mailing list available on Sourceforge.
Cheers,
-Dave
Posted by Dave Mangot on November 02, 2011 at 01:43 PM PDT #