
Showing a Gigabit OpenBSD firewall some Monitoring Love
I have a pretty long history of running my home servers or firewalls on “exotic” hardware. At first, it was Sun Microsystem hardware, then it moved to the excellent Soekris line, with some cool single board computers thrown in the mix. Recently I’ve been running OpenBSD Octeon on the Ubiquiti Edge Router Lite, an amazing little piece of kit at an amazing price point.
Upgrade Time!
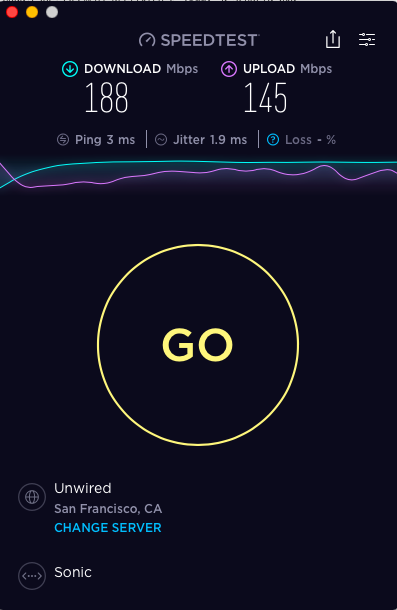
This setup has served me for some time and I’ve been extremely happy with it. But, in the #firstworldproblems category, I recently upgraded the household to the amazing Gigabit fibre offering from Sonic. A great problem to have, but also too much of a problem for the little Edge Router Lite (ERL).
The way the OpenBSD PF firewall works, it’s only able to process packets on a single core. Not a problem for the dual-core 500 MHz ERL when you’re pushing under ~200 Mbps, but more of a problem when you’re trying to push 1000 Mbps.
WELP.

I needed something that was faster on a per core basis but still satisfied my usual firewall requirements.
Loosely:
- small form factor
- fan-less
- multiple Intel Ethernet ports (good driver support)
- low power consumption
- not your regular off-the-shelf kit
- relatively inexpensive
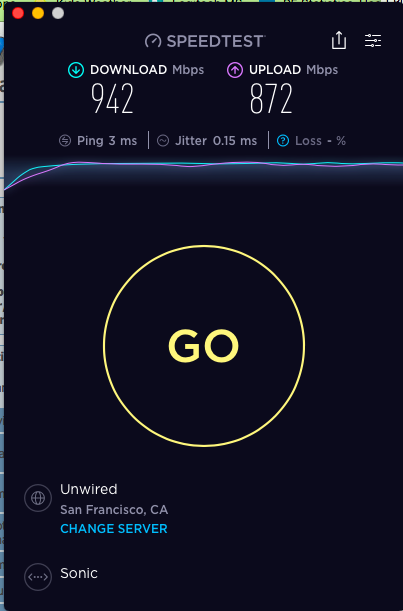
After evaluating a LOT of different options I settled on the Protectli Vault FW2B. With the specs required for the firewall (2 GB RAM and 8 GB drive) it comes in at a mere $239 USD! Installation of OpenBSD 6.4 was pretty straight forward, with the only problem I had was Etcher did not want to recognize the ‘.fs’ extension on the install image as bootable image. I quickly fixed this with good old Unix dd(1) on the Mac. Everything else was incredibly smooth.
After loading the same rulesets on my new install, the results were fantastic!
Monitoring
Now that the machine was up and running (and fast!), I wanted to know what it was doing. Over the years, I’ve always relied on the venerable pfstat software to give me an overview of my traffic, blocked packets, etc. It looks like this:
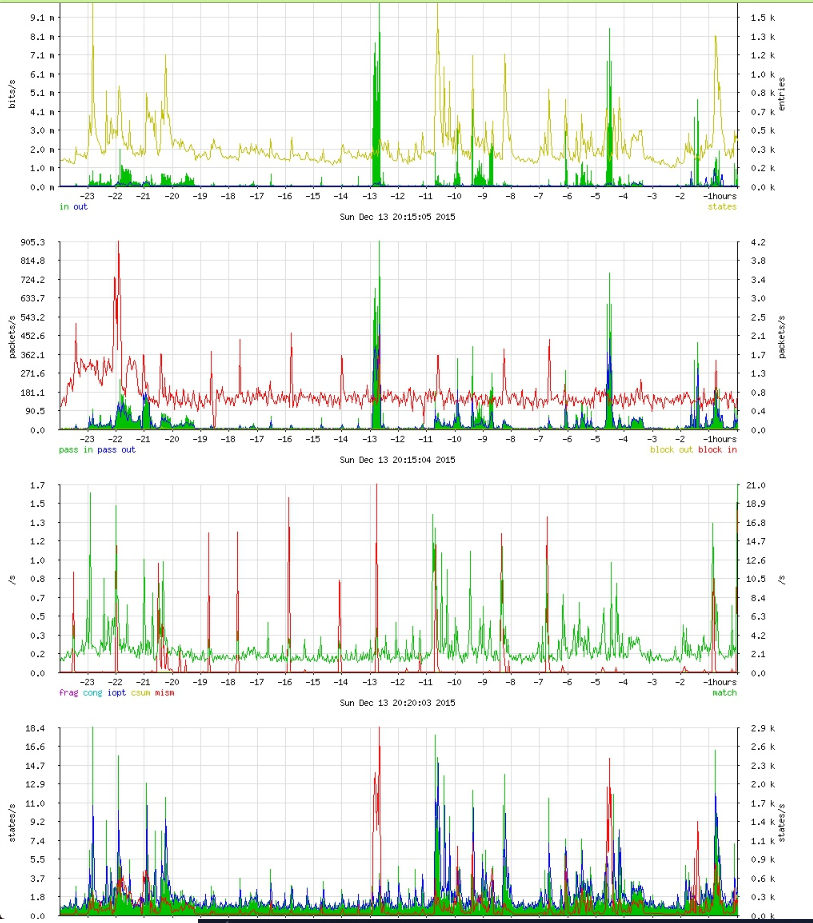
As you can see it’s based on RRDtool, which was simply incredible in its time. Having worked on monitoring almost continuously for almost the past decade, I wanted to see if we could re-implement the same functionality using more modern tools as RRDtool and pfstat definitely have their limitations. This might be an opportunity to learn some new things as well.
I came across pf-graphite which seemed to be a great start! He had everything I needed and I added a few more stats from the detailed interface statistics and the ability for the code to exit for running from cron(8), which is a bit more OpenBSD style. I added code for sending to some SaaS metrics platforms but ultimately stuck with straight Graphite. One important thing to note was to use the Graphite pickle port (2004) instead of the default plaintext port for submission. Also you will need to set a loginterface in your ‘pf.conf’.
A bit of tweaking with Graphite and Grafana, and I had a pretty darn good recreation of my original PF stats dashboard!
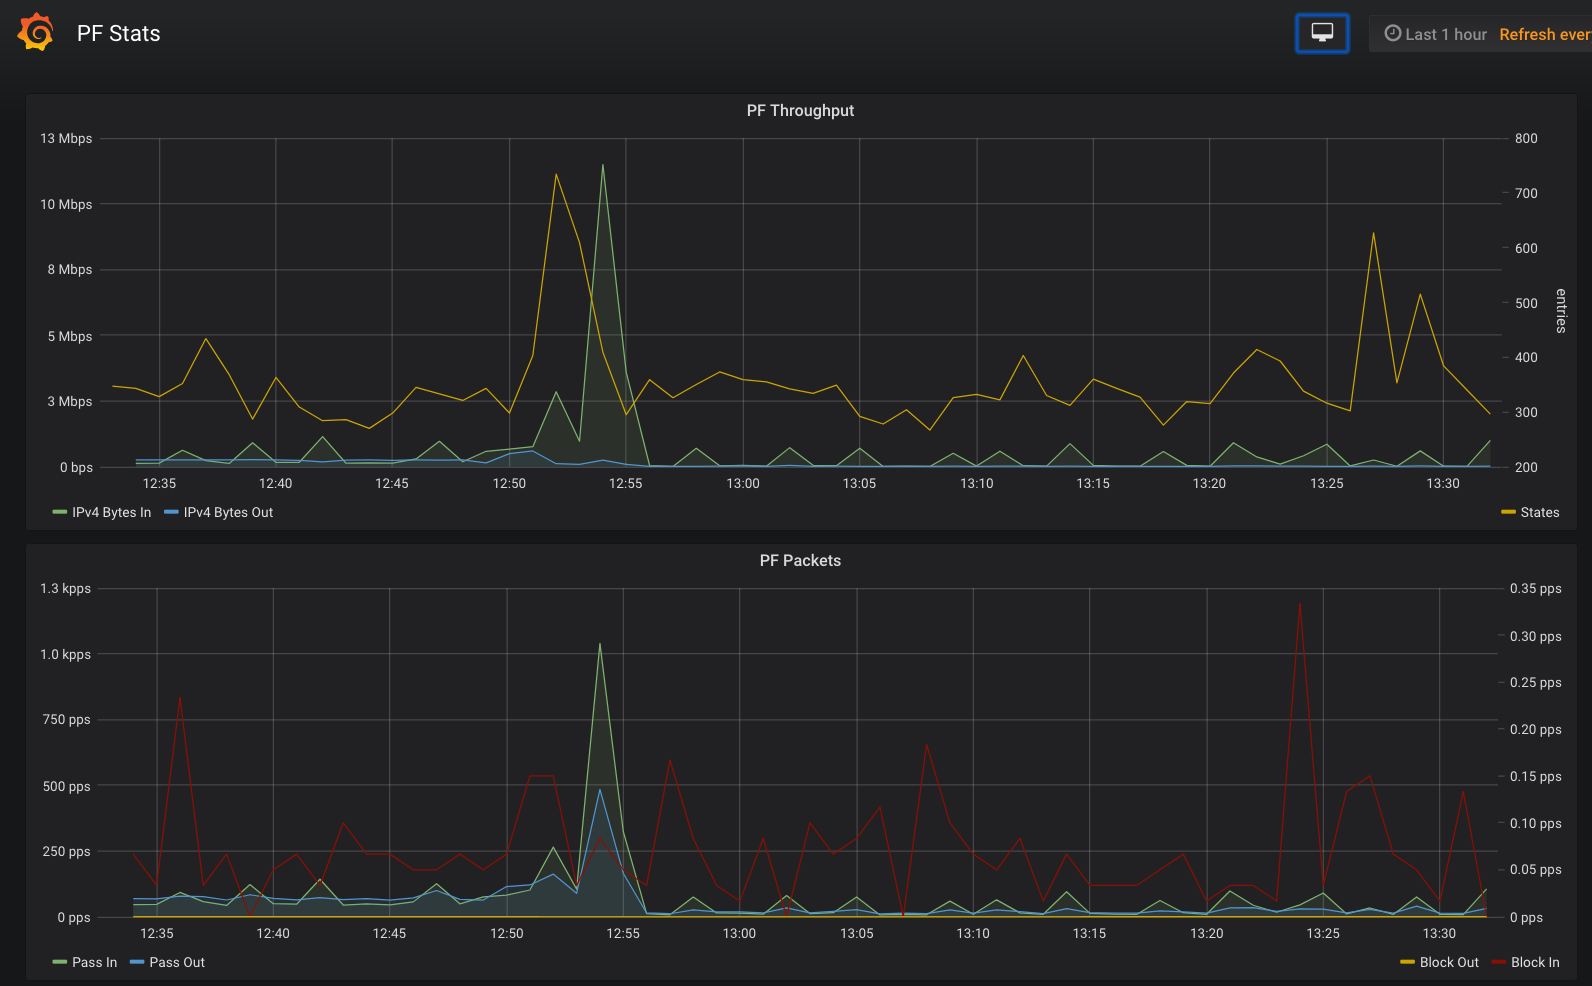
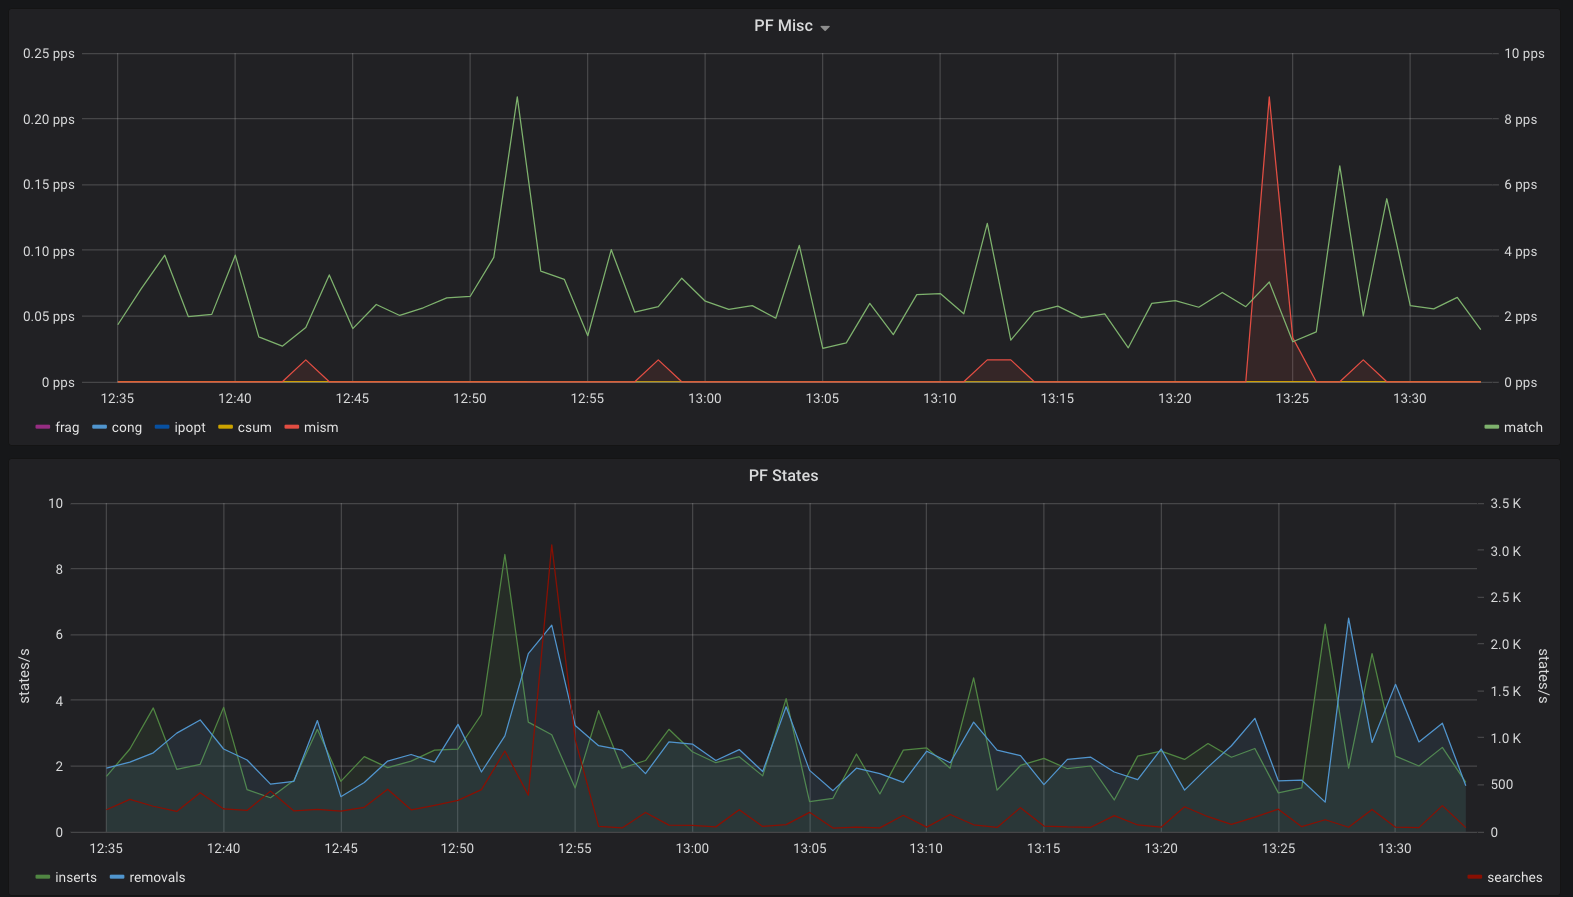
I’ve added the JSON for the Grafana dashboard as well as some other changes to my fork of the repo.
Because it’s a Grafana dashboard, you can use it with many different backends if Graphite doesn’t suit you.
Hope you find it useful!
Update July 2023
I had a lot of networking trouble with the 7.2 and 7.3 releases until I did this:
 echo "disable inteldrm" > /etc/bsd.re-config
 chmod 0600 /etc/bsd.re-config
 /usr/libexec/reorder_kernel
 shutdown -r now