 Wednesday May 23, 2012
Wednesday May 23, 2012
Wednesday May 23, 2012
Ode to the External Node Classifier (ENC)
![]()
External Node Classifier, how do I love thee? Let me count... There has been a great deal of attention lately being paid to the backends that are available in my current configuration management tool of choice, Puppet. I'm sure Chef must have some similar types of constructs. The buzz is about Hiera, which is a pluggable hierarchical database for Puppet. Which means that when Puppet is looking up information about a node, it can look in multiple places. I think this is a great idea, and at Tagged we have been using something similar that we are in love with for a few years, the External Node Classifier (ENC).
What the ENC allows us to do is make a call to our centralized management database (CMDB) for each host that calls in for Puppet configuration. We return a bit of YAML from our Perl script, and Puppet uses that information to configure the node. Click on the link above to find out more about how it works. The powerful thing about this mechanism, is that we can return almost anything we want for Puppet to use. Each variable that we return in the YAML can be used as an actual variable in our Puppet manifests. This is what's so amazing about the ENC, it allows us to organize our network of hosts however we want it, with almost no preconceived notions of what we are going to want to build next (within reason of course).
---
classes:
  - web
environment: production
parameters:
  SpecId: 6
  appType: web
  cabLocation: 98b
  cageLocation: 34
  consolePort: 19
  cores: 8
  cpuSpeed: 2.53GHz
  ganglia_cluster_name: Web
  ganglia_ip: 172.16.11.34
  ganglia_ip2: 172.16.11.35
  ganglia_port: 8670
  gen: 4
  portNumber: 19
  vendor: Dell
Sure we could pre-allocate large chunks of the network for web servers, and another chunk for security services. But what if we guess wrong? What if they don't all fit into a /24, or a /23. What if we allocate a /28 but it turns out we need a /25? This is a problem. It gets worse if you consider that you actually don't want your memcached servers to be in a different subnet than your web servers. In a datacenter environment, latency is important, and layer 2 is the only way to go for some applications. Routing will kill you.
So, what to do? Enter the ENC. Our ENC returns lots of information, but at a high level, it returns our Puppetclass and what we call an AppType, which is like a subclass. For example, the Puppetclass may be web and the AppType imageserver. Now, I can actually slice my hosts any way I want to. The same group of engineers should be able to login to the imageserver hosts? No problem, distribute an access control file based on AppType. All the imageservers should get the same Apache configuration? Again, not a problem. If an imageserver and a PHPserver are in sequential IPs, it does not matter. If they have a memcached host situated on an IP in between? Again, not a problem. Puppet will take care of ensuring each host gets the proper configuration.
But it actually get's better. Using the ENC, we can actually group hosts any way that we imagine. One thing we use very heavily at Tagged is Ganglia. Very simply, we could map Ganglia clusters to AppTypes. We don't even need to simply return the AppType, we could actually return the Ganglia configuration for each host and plug that into a Puppet ERB template. This is where it gets interesting. We actually combine multiple AppTypes into Ganglia clusters in some cases. For example, our security group has all kinds of different applications that they use to keep our users safe and secure. Some are on one server, some are on many, but it is very unlikely that our security group needs to get a large "cluster-wide" view of an application tier. Very often they are looking at the performance of individual hosts. If we were segmented by IP address, we would have to guess how many applications they would develop over some arbitrary time period. If we were segmented purely on AppType, we might have 10 different Ganglia clusters with one or two hosts each.
But because of the power of the External Node Classifier, we can actually slice and group our network of hosts any way that we choose, in ways that serve our purposes best. When we changed from collecting our system information from Ganglia gmond to Host sFlow, it was literally a change to a few variables and templates, and within 30 minutes, we had a completely different monitoring infrastructure. It was that simple.
If you haven't looked at the more capable backends to Puppet or your current configuration management tool of choice, you should. Just like "infrastructure as code", a little up front hacking, goes a long, long way.
Posted by Dave Mangot in Applications at 20120523
Tuesday November 01, 2011
Host-based sFlow: a drop-in cloud-friendly monitoring standard

Everyone who is a professional sysadmin knows that part of the excitement and drain of our jobs, is keeping track of all the different technologies out there, how and what to add to our toolbox, and what's coming next.
Sometime we are lucky enough to bump into an old friend that has grown and matured over the years. I'm talking about technology, and in this case, sFlow. I used a number of Foundry (now Brocade) switches at different companies over the years and they all implemented sFlow. I would send all my sFlow data to various different collectors at different jobs, and was constantly amazed at the power and versatility of this technology.
One of the things in which sFlow really excels in the network space is doing things like showing you the "top talkers" on a network segment. It does this by sampling the packet stream and allowing you to see what it sees. This is much more efficient than trying to capture every packet. When you are able to adjust the amount of sampling you do based on the packet count you experience, you are able to handle much larger volumes of traffic with a high degree of confidence in your data. I always thought that it would be great if I could get this level of visibility on my application tier, and now I can.
The sFlow community has been making great strides with Host sFlow which takes some of the same great characteristics from the network sFlow standard and applies them on the host and application side. This means that you can actually find out which URLs are being hit the most, which memcache keys are the hottest, and how that correlates with what you are seeing on the network.
Setup
Setting up host-flow could not be much easier. First, you can download packages for FreeBSD, Linux, or Windows from the SourceForge Site. Once installed, when you start the daemon; on Linux, it will check /etc/hsflowd.conf to find out where the sFlow collector(s) are located. This is where the daemon will send all the data. You can also set things like polling and sampling rates in this file. If you wish, you may also define these using the location services in DNS. That's it.
You will also need a collector. The simplest collector is sflowtool which will capture the packets and present them to you in various formats all of which are consumable by your favorite scripting language. There are many collectors to choose from. At Tagged one of our favorite collectors is Ganglia!.
As of Ganglia 3.2, it can understand and process sFlow packets. At Tagged, we have replaced all of our gmond process with hsflowd.
Efficiency
One of the great things about replacing our gmond processes is that our monitoring infrastructure is now much more efficient. With gmond, every metric that you measure sends a packet across the wire. If you sample every 15 seconds, it simply sends a packet every 15 seconds, for each metric that you monitor. With hsflowd, you can sample every 15 seconds, but hsflowd will batch all those metrics up into a single packet and send those across the wire. We are actually able to collect more metrics, more often, with less packets. On a big network like Tagged, anything we can do to lower our packets per second is a big win. The difficult part was converting from multicast which a trivial setup to unicast. We took it as an opportunity to templatize all our puppet configs for this purpose based on our CMDB. Now we have a system that we really love.
A Standard, Really
Perhaps one of the things that was most challenging to wrap our heads around is that sFlow is not a replacement for our Ganglia or Graphite tools. sFlow is a standard on switches and it's a standard on the host side too. That does not mean that you cannot instrument your own applications with sFlow. It means that this is not the default configuration for sFlow. It means that if you are going to look at your HTTP metrics whether they come from Apache, Nginx, or Tomcat, they are going to be the same metrics.
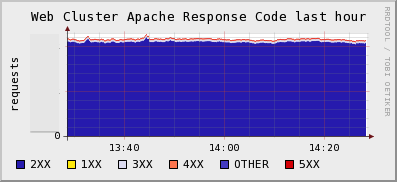
If you want to monitor things like the number of active users on your site, you can still do those things with gmetric or graphite. However if you want to be able to find out how many of your HTTP requests have 200, 300, or 500 response codes, and you want to be able to do that in real-time across a huge web farm ( which makes log analyzers and packet sniffers completely impractical) then you want mod-sflow (for Apache).
Solves The Java JMX Problem
There are a few other things that have me excited about sFlow. One, is that it solves the JVM monitoring problem. Ops folks always want to know how their Tomcat or JBoss servers are running. You can buy fancy tools from Oracle to do this, or you can use the jmx-sflow-agent. Typically, the way we solve this problem is that we either fire up a tool like check_jmx which basically fires up a JVM each and every time it needs to check a metric *shudder*, or we run a long running java process that we need to constantly update with a list of servers to poll in order to get graphs of our heap sizes.
Alternatively you could run jmx-flow-agent which runs as a -javaagent argument to the jvm command line and have all your JVMs automatically send their metrics to a central location the moment they start.
Cloud-Friendly
That's the thing. When applications start up, they start sending their data via sFlow to a central location for you. There is no polling. This is the same model as all the next generation of monitoring tools like Ganglia and Graphite. This is cloud-friendly.
Imagine you were Netflix running thousands of instances on EC2. Would you rather have to update your config file every few seconds to make your monitoring systems aware of all the hosts that have been provisioned or destroyed, or would you like new hosts to just appear on your monitoring systems as the hosts appear? At Tagged, we would be constantly updating our config files every time a disk failed, or when a tier was expanded or a new one provisioned. We would have to specify in the file, which hosts were running Java, or Memcache or Apache, or both.
Instead, in our world, if an application is running on a host, we see that application in our monitoring tools, instantly. Deploying mod-sflow to your apache servers was as simple as creating an RPM and putting a few lines in Puppet. Awesome.
The Future
sFlow's relationship with the host side of the equation is just picking up steam now. We've been lucky enough to be at the leading edge of this, mostly through my giving my LSPE Meetup Talk at on the right day, at the right time. In the coming weeks, we hope to share more with the world what we're getting from using sFlow on our network, why we are loving it, and what problems it's helped us to solve.
Posted by Dave Mangot in Applications at 20111101 Comments[2]
Tuesday June 21, 2011
Graphite as presented to the LSPE Meetup 16 June 2011 My talk at the LSPE Meetup.[Read More] Posted by Dave Mangot in Applications at 20110621
Wednesday March 02, 2011
As part of working on a large scale website like Tagged we are constantly exploring new technologies to see what might be advantageous to help with the site. Whether it's exploring NoSQL technologies, new storage or server hardware, or visualization tools, there is no shortage of software and hardware to try.
Recently, we've been trying out the Graphite Realtime Graphing system. It started as an experiment during our latest Hackathon, and the more we've tried it, the more things there are to like. Because the current Graphite documentation doesn't include a CLI tutorial, I thought it might be nice to write one.
One of the first things you notice when using Graphite is how powerful
and flexible its graphing system is. Sometimes I feel like Tom
Cruise in the "Minority Report" being able to have complete control
over the way I manipulate and visualize my data. One of the great
things (I guess if you're a Unix geek) about Graphite is that it also
comes with a CLI.
To access the CLI, simple point your browser at
http://yourgraphiteinstall/cli or just click the link on the top of
the regular composer window. You will be presented with a prompt like
this:

If you haven't logged in yet (here I am logged in as "admin"), simply
type 'login' at the command prompt and you will be taken to a screen
where you can login to Graphite. Without being logged in, we will be
unable to save our views, which we will get to a bit later.
While we can simply begin drawing graphs, right inside the actual
cli, I prefer to draw them inside windows. This way, if you create
multiple windows and save them as a view, you can move them around,
resize them, etc, independently of one another. To create a new
window, type 'create windowname' and it pops up on your screen:
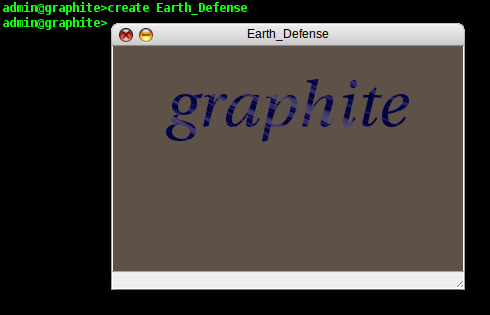
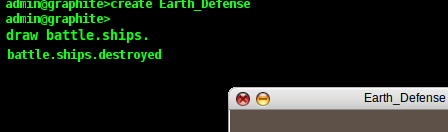
Now we have somewhere to plot our data. For the purposes of this
tutorial, we have populated our datastore with some fictionalized data
about some Earth defense stations that are using their lasers to blast
invading ships out of the sky. Now we are going to plot how the
individual stations are doing. In reality, this data can be anything
that you can get into Graphite (networking data, number of users on a
site, temperature, stock prices, etc). In the CLI, I type 'draw
battle.ships.' and as I type, Graphite automatically shows me below
the cursor all the possible completions for my namespace as I
type:
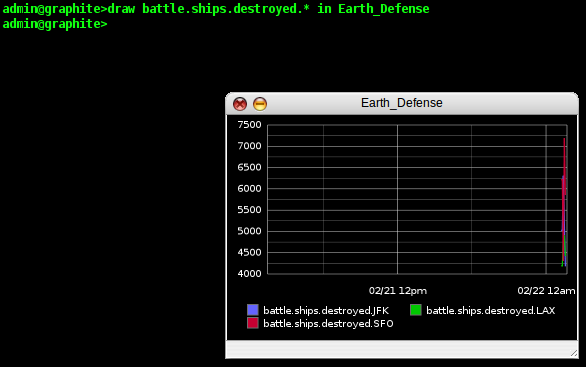
One of the nice things about using a CLI is that I can use
wildcards, so for this example, I type 'draw battle.ships.destroyed.*
in Earth_Defense' and Graphite shows me my data in the window on a
smart looking graph. It has automatically matched all the different
parts of my namespace and plotted them individually on the graph (in
this case, SFO, JFK, and LAX).
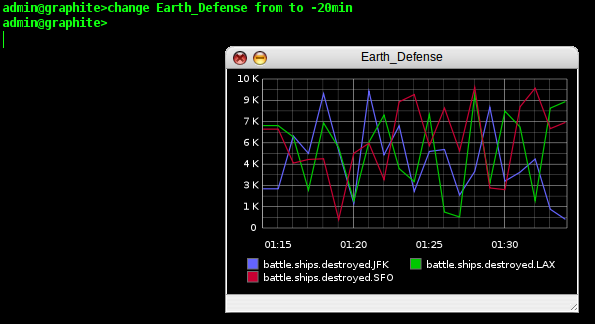
That's pretty nice, but it's difficult to see how the individual
battle stations are doing because we've only recently been getting our
reports in from the stations. So, we need to change the timescale of
our graph. In the CLI, this is trivially easy. We type 'change
Earth_Defense from to -20min' and the timescale on our window is
updated instantly.
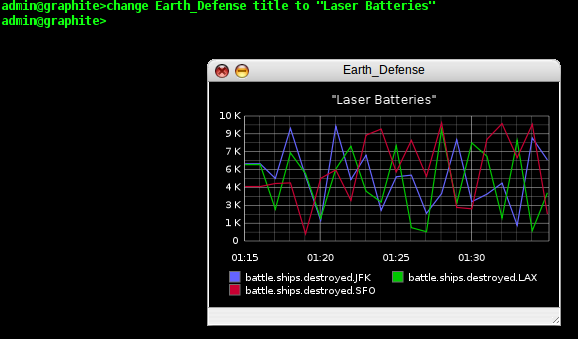
If we are going to send these reports to our superiors, they might
not be as tuned into our data collection methods as we are, so let's
add a title to our graph. We type 'change Earth_Defense title to
"Laser Batteries"' and Graphite updates our graph once again.
That is just one example of a way we can manipulate a graph in the
CLI, but in reality, we can not only change the chrome of our graph,
but also work with the data itself. Maybe the generals in charge our
our battle don't care about the individual battle stations, they want
to know about the total number of ships destroyed minute by minute.
So let's give them a total they can see on the graph. We type 'add
sum(battle.ships.destroyed.*) to Earth_Defense' and our total
kills now appears on the graph:

There are lots more things we can do with the CLI, and many more
manipulations we can do on our graphs, but for now, we want to be able
to save our graph, so that we can return to it later. In the CLI
this is called a "view". You can have multiple windows/plots saved
in a view, but we are going to save our view now by typing 'save
laserreport'.
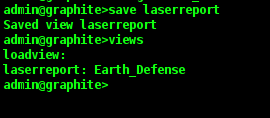
If at some point in the future, we wanted to get this report back, we
could simple type 'views' to get a list of all the different
saved views, followed by 'load viewname' to actually retrieve
the report.
Of course having an easy to use CLI like graphite also allows us to do other powerful things. Having a CLI is almost like having a basic API, so we can actually script what we will cut and paste into our CLI in order to automate repetitive actions. We'll use this Ruby script as a basic example.
#!/usr/bin/ruby

graphite = { "Apple" => "AAPL", "Google" => "GOOG", "Visa" => "V" }
graphite.each { |key, value| puts "create #{key}\ndraw stocks.#{value} in #{key}\n" }
Here we take a hash with information about our window titles and iterate through a list of stock quotes we have in our Graphite installation. You can imagine the possibilities this can give you. Here's the output:create Visa draw stocks.V in Visa create Google draw stocks.GOOG in Google create Apple draw stocks.AAPL in Apple
Graphite is an exciting tool that is becoming easier to use and more capable with every release. Currently we're trying to see how it compares to the tools that we have internally (like you can see here). There are a number of compelling attributes to both tools and it may be the case that one tool will not be the best fit for all cases. In the few short weeks we've been experimenting with Graphite, at the very least, it's proven to be a great addition to the sysadmin's toolbox.
Posted by Dave Mangot in Applications at 20110302 Comments[2]
Monday August 17, 2009
A framework for running anything on EC2: Terracotta tests on the Cloud - Part 1 A framework for running Terracotta (or any other) software on EC2[Read More] Posted by Dave Mangot in Applications at 20090817 Comments[3]
Tuesday August 04, 2009
A Trade Show Booth: Part 2 - The Puppet Config After writing the blog post about running a trade show booth with OpenBSD and PF, a few people asked about the puppet configuration. The configuration is actually dead simple. The idea is to configure the machines with the base configuration they need, as well as provide for future management. Because this is such a simple environment, we are able to keep the flexibility of both configuration management coupled with instantaneous change. The best way to understand this is just to have a look at the site.pp.
import "classes/*.pp"

node default {
        include rootssh
        include tchomedir
        include postfix
        include mysql
}
Let's look at each file in turn
rootssh
class rootssh {
  file { "/root/.ssh":
        owner => root,
        group => root,
        mode => 700,
        ensure => directory
        }
  file { "/root/.ssh/authorized_keys":
        owner => root,
        group => root,
        mode => 700,
        content => "ssh-dss AAAAB...truncated...N==",
        require => File["/root/.ssh"]
        }
}
I know there is a puppet directive to handle ssh keys but it doesn't work, at least it didn't in my setup. Using 'content' to the 'file' type works well. This enables the puppetmaster (OpenBSD box) to control all the puppet hosts as root. Turns out we didn't need to use this very much but it's handy to have nonetheless.
tchomedir
class tchomedir {
  file { "/home/terracotta/terracotta":
        owner => terracotta,
        group => terracotta,
        ensure => "./terracotta-3.1.0-beta.jun2",
        }
  file { "/home/terracotta/examinator":
        owner => terracotta,
        group => terracotta,
        ensure => "./examinator-cache-1.2.0-SNAPSHOT.jun2",
        }
  file { "/home/terracotta/Destkop/Demo.Deck.Simple.2.2.pdf ":
        owner => terracotta,
        group => terracotta,
        mode => 755,
        name => "/home/terracotta/Desktop/Demo.Deck.Simple.2.2.pdf",
        source => "puppet:///dist/Demo.Deck.Simple.2.2.pdf"
        }
  file { "/home/terracotta/.bashrc":
        owner => terracotta,
        group => terracotta,
        ensure => present,
        source => "puppet:///dist/bashrc"
        }
}
We already had the terracotta user and group created, though this could have been easily done in puppet, maybe next year. Here we make sure that the "terracotta" and "examinator" symlinks are always pointing to the right kits. We distribute a PDF file used for the demos, and make sure everyone has the same centrally configured .bashrc
postfix
class postfix {
  package { "postfix":
        name => postfix,
        provider => apt,
        ensure => present
        }
  file { "/etc/postfix/main.cf":
        owner => root,
        group => root,
        source => "puppet:///dist/main.cf"
        }
  service { "postfix-svc":
        ensure => running,
        subscribe => File["/etc/postfix/main.cf"],
        require => Package["postfix"],
        name => postfix
        }
}
Pretty simple and demonstrates what is pretty awesome about puppet. This definition retrieves and installs postfix, gets the postfix configuration from the puppetmaster and makes sure postfix is running. It will even reload the postfix configuration if the main.cf on the puppetmaster changes.
mysql
class mysql {
  file { "/etc/init.d/mysql":
        owner => root,
        group => root,
        source => "puppet:///dist/mysql"
        }
  service { "mysql-svc":
        ensure => running,
        subscribe => File["/etc/init.d/mysql"],
        name => mysql
        }
}
Here we could have used puppet to install mysql just like we did for postfix, but it is already on there from the machine build. We replace the init script for mysql with our own with some custom arguements and then make sure the service is running.
Distributing the Terracotta kits
To distribute the Examinator and Terracotta kits we used prsync in the PSSH kit by Brent Chun. It can run a command, sync over rsync, etc. to 32 machines over ssh in parallel by default, and more if configured that way. With this we ran a single prsync command that distributed out each directory to all the machines at the same time whenever we needed to update the kit.
Questions
So there are two questions that might be asked about this configuration.- Why aren't you using puppet to distribute the kits?
- Prior to the new Puppet 0.25 RC just released with the beginnings of a move toward REST from XML-RPC, puppet has been terrible at recursively copying large directory trees. We tried to distribute the Terracotta kit with all its directories and jars and it blew up running out of file descriptors. The is reportedly fixed in the RC mentioned above.
-
Why are you using prsync instead of puppetrun?
- Because we couldn't use puppet to distribute the kits so triggering the run can only be used to shift the symlink. We could have used an exec directive in the puppet config to pull the file from somewhere and untar it but that seems no less hackish.
Summary
Using puppet definitely makes our lives easier when setting up a trade show booth. This is the first year we've used puppet and I've already learned a lot about the tool and will be using it even more extensively next year to separate the OS install, from the booth dependencies (e.g. mysql). See you at JavaOne!
Posted by Dave Mangot in Applications at 20090804
Tuesday June 23, 2009
A Trade Show booth with PF and OpenBSD
A few months after I started at Terracotta I attended my first JavaOne conference. Not as an attendee, but as an exhibitor. The boss came and asked me to build up some infrastructure to run a booth. Over the years, the setup of the booth and some of the software and equipment has changed, but the primary design principles have not.
- Allow all machines in the booth to share a single Internet connection
- Make it simple to setup and use
- Allow employees to check their email, etc. from the booth
- Allow the sales engineers to explore potential client websites
- Do not allow demo stations to be used by conference attendees to check their email or hog the demo station trying to show us their website
- Make it secure so that we don't have any demo "surprises"
- Make sure all the demo stations are consistent
I turned to one of my favorite operating systems to solve the problem, OpenBSD. Here is what the network looks like as of 2009.
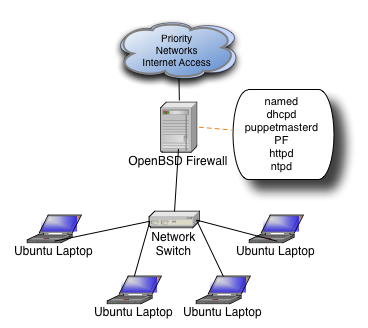
We get our Internet connection from Priority Networks and every year it is rock solid, they are super easy to work with, and when you need help, they actually know what you're talking about!
As you can see, each daemon on the machine serves a purpose to running the overall network. Each daemon (other than PF) is only assigned to the internal interface.
- named
- We run a private domain inside the booth (javaone.tc) and also need standard resolving for internal clients
- dhcp
- Demo machines are given static IPs, all other clients are assigned to a different part of the subnet, more on this later
- puppetmasterd
- Now that machines have gotten faster and we have less graphical demos, we can run all Unix demo stations. Puppet makes sure all the machines are 100% consistent and makes it much easier to setup machines initially or substitute in a new station in case of some kind of problem
- PF
- This is where all the magic happens, why you can type www.yahoo.com and wind up at Terracotta.org
- httpd
- This was more important before puppet and when we still had Windows, but Apache is still a great way to serve up files to any network
- ntpd
- We're a Java clustering company and it's very important to have synchronized clocks in a cluster, then again, isn't it always?
As you can see above, we have a private domain inside the booth. It's just a simple /24 divided in two. Machines in the lower half of the subnet are assigned static IPs by MAC address, this is for the demo stations only. Machines in the top half of the subnet (129-254) are assigned IPs dynamically and this range is for any employee who brings their laptop to the booth and wants to login to check email, fix a bug, etc. PF treats the two IP ranges differently.
Here is the firewall ruleset:
ext_if="bge0"
int_if="dc0"
DEMOSTATIONS="192.168.100.0/25"
EMPLOYEES="192.168.100.128/25"

set skip on lo
# allow demo stations to access Terracotta and a few other websites we rely upon
table <TCOK> { 64.95.112.224/27, www.google-analytics.com, now.eloqua.com, secure.eloqua.com,  download.terracotta.org }
scrub all

nat-anchor "ftp-proxy/*"
rdr-anchor "ftp-proxy/*"
nat on $ext_if from $int_if:network -> ($ext_if:0)
rdr pass on $int_if proto tcp from $int_if:network to port 21 -> 127.0.0.1 port 8021
rdr pass on $int_if proto tcp from  $DEMOSTATIONS to ! <TCOK> port 80  -> 64.95.112.233  port 80
rdr pass on $int_if proto tcp from  $DEMOSTATIONS to ! <TCOK> port 443  -> 64.95.112.233  port 80

anchor "ftp-proxy/*"
block log all

pass quick on $int_if no state
antispoof quick for { lo $ext_if }

# fw inbound - for remote admin when Priority Networks allows this
pass in quick on $ext_if proto tcp to ($ext_if) port ssh

# fw outbound
pass out quick on $ext_if proto tcp from ($ext_if) to any modulate state flags S/SA
pass out quick on $ext_if proto udp from ($ext_if) to any keep state

# int outbound
pass in quick proto tcp from $DEMOSTATIONS  to any port { 22 25 80 443 8081 } modulate state flags S/SA
pass in quick proto udp from $DEMOSTATIONS  to any port { 53 } keep state
pass in quick proto tcp from $EMPLOYEES to any modulate state flags S/SA
pass in quick proto udp from $EMPLOYEES to any keep state
The only problem with this ruleset is that the name resolution for domains that are hardcoded in the ruleset (e.g. www.google-analytics.com) can only really happen after the OS has booted. Otherwise, the boot sequence stalls on name resolution. The workaround for this is to disable PF in /etc/rc.conf.local and enable it with
pfctl -e -f /etc/pf.confin /etc/rc.local. That is really the only necessary workaround.
As you can see, it's actually a REALLY, REALLY permissive ruleset. Much more permissive than we allow in the office. Because there is rarely a Terracotta sysadmin on the show floor during the conference, and because there are tons of open access points which our employees would use if we locked them down too much anyway, we feel this is a pretty acceptable level of risk for the few days of the show. We could certainly lock down the ports employees could access, restrict to their MAC addresses, or even put in authpf for them to authenticate, but that would mean maintaining a password file outside the corporate office, or duplicating the LDAP server, or setting up an IPSEC tunnel, all of which are excessive for a few days of conference.
That's really all there is to it (other than some GENERATE statements in the zone files). Free, functional, easy, and secure by OpenBSD. Posted by Dave Mangot in Applications at 20090623 Comments[3]
Wednesday May 13, 2009
EC2 Variability: The numbers revealed
Measuring EC2 system performance
I've been spending a lot of time at Terracotta working on cloud deployments of Terracotta and the cloud in general. People have been asking me what the difference is running apps on the cloud, and specifically EC2. There are a number of differences (m1.small is a uni-processor machine!) but the number one answer is "Variability". You just cannot rely on getting a consistent level of performance in the cloud. At least not that I've been able to observe.
I decided to put EC2 to the test and examine three different areas that were easy to measure: disk I/O, latency, and bandwidth
Disk I/O
- Environment: EC2 m1.small
- File size: 10 MB (mmap() files)
- Mount point: /mnt
- Testing software: iozone
- Duration: almost 24 hours

As you can see the numbers can vary a good deal. This is on an otherwise completely quiescent virtual machine and with a 10 MB filesize, the tests themselves took almost no time to run. Most of the numbers actually look remarkably consistent with the exception of Random Reads. Those numbers are all over the place which you might expect from "random" but this looks to be a bit much. The numbers are actually pretty respectable and compare to about a 7200 RPM SATA drive. Certainly not the kind of machine you would use for performance benchmarks, but if you threw enough instances at a clustering problem, you could certainly get the job done.
Latency
- Environment: EC2 m1.small
- Datacenter: us-east-1b
- Testing software: smokeping
- Duration: about 20 hours
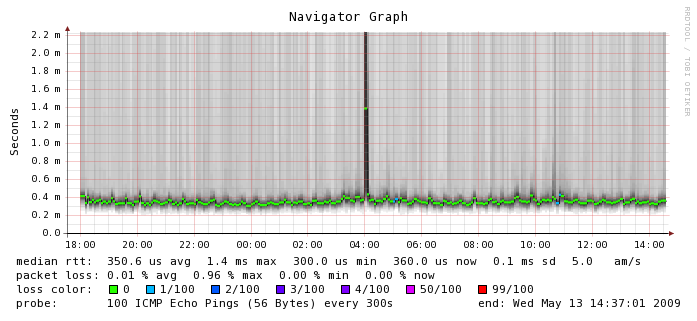
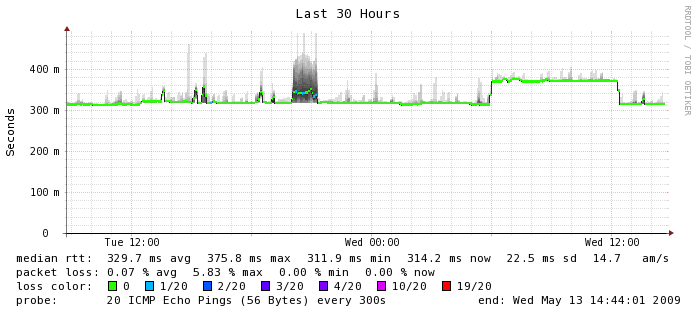
Here, where networking is involved between instances, things start to get a little bit more varied. The median RTT is 0.3506 ms which is about 3 times more latency than you would get on a typical gigabit ethernet network. You can see the numbers hover there for the most part but there is a tremendous amount of variability around that number. Smokeping shows outliers about 2 ms but I have seen numbers as high as 65 ms or worse in ad hoc tests. I don't know what happened at 4 a.m. on this graph but I'm glad I wasn't running a production application at the time. If you look closely, you can also see a few instances of packet loss which is something we don't usually experience on a production network. Again, this is on an otherwise quiescent machine. For comparison's sake, here is the smokeping graph between Terracotta's San Francisco and India office which is actually carrying a fair bit of traffic. This is a LAN to WAN comparison so the numbers are not going to look as exaggerated because they are running on a different scale, but in the EC2 instance, we can see more than 5 times the variability in latency, which we don't see on the WAN segment (or ever on any of my lab switches for that matter).
Bandwidth
- Environment: EC2 m1.small
- Datacenter: us-east-1b
- Testing software: nttcp
- Duration: about 24 hours
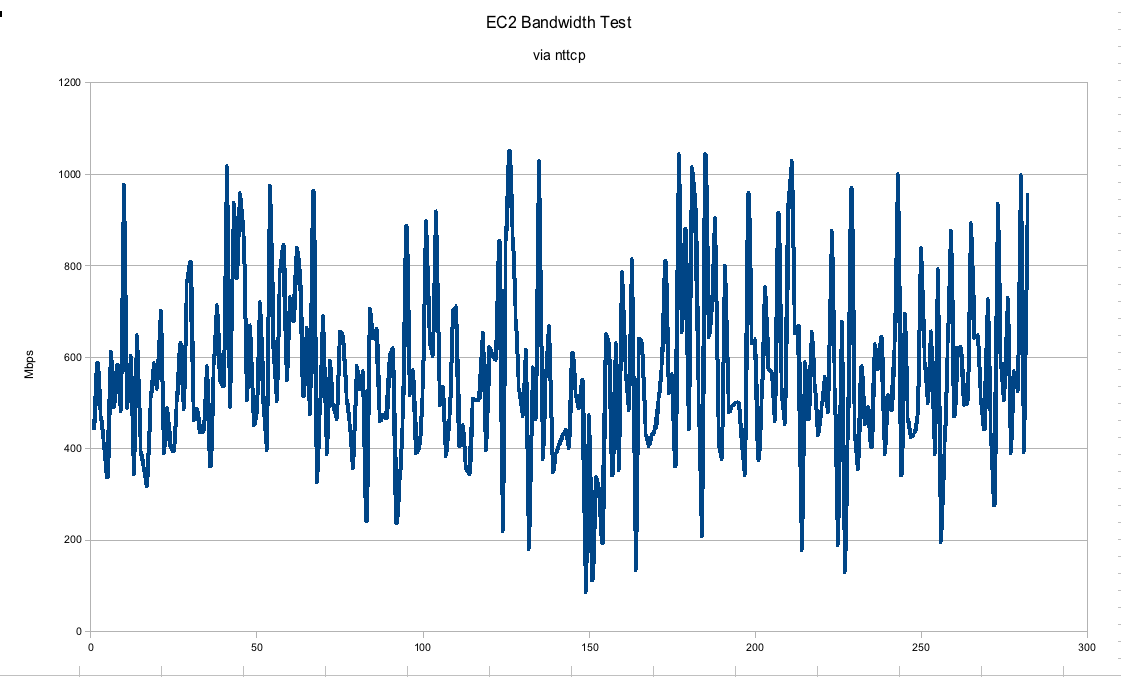
In this graph, we can see that the gigabit connection between EC2 instances is hardly gigabit at all. I would say the numbers may trend upwards of 600 Mbps on average but they fluctuate pretty wildly between real gigabit to barely faster than a 100 Mbps connection. This was run on an otherwise quiescent machine. In a real "production" environment we would expect much more consistency, especially if trying to run performance numbers.
Conclusions
It is pretty safe to say that there won't be any vendors publishing performance numbers of what they are able to achieve with their software running on the cloud unless they had no other choice. You can easily get much more consistent, faster numbers running on dedicated hardware. In our tests with Terracotta, we've seen that you just have to throw that much more hardware at the problem to get the same kinds of numbers. It stands to reason however as a uni-processor m1.small instance is just not going to be as powerful as our quad-core Xeons. In throwing more instances at the problem you start to introduce more of the network into the equation, which as you can see, is a rather variable quantity. Thankfully, the amount of latency introduced even in this case is no big deal for the Terracotta server, so I've been having a pretty good time running bigger and bigger clusters in the cloud.
Posted by Dave Mangot in Applications at 20090513 Comments[5]
Thursday February 07, 2008
Choosing Zimbra as told to ex-Taosers@groups.yahoo
We're running Zimbra in production and have been for almost a year now. We're running Network Edition (paid) with Mobile.
Eh. It's ok.
Of course our philosophy is to let anyone run anything they want. Zimbra would seem to support this philosophy but I sometimes wonder if it tries to do too much.
Messaging is pretty rock solid. Other than some stupid bugs like showing 20 messages in your Drafts folder and then when you click on it, there is nothing there, it works fine. I've never heard about any lost messages or anything like that.
Calendar is wonky however. You can't set variable reminders for meetings. That means, either get a 5 (or 10, or 15) minute warning for every meeting you have or nothing. So if you have a sales meeting across town that you want to have a 30 minute reminder for, and a budget meeting down the hall you want a 5 minute reminder for, can't do it. It's one of the most voted on bugs in bugzilla and has been for a while, but they say they'll fix it maybe in 5.5. Weird.
Plus, the calendar is just buggy. Meetings don't show up all the time. If you change a meeting time, free/busy gets screwed up. I've had a user whose iSync just stopped putting on new meetings twice. All kinds of headaches.
Of course we support, Blackberrys (via NotifyLink Inc.), Treos, iPhones, Outloook connector, iSync connector. Basically, every bell and whistle you can ring or blow in Zimbra so sometimes it's user error, but sometimes it's Zimbra.
Despite this, I was planning on running Zimbra for mangot.com mail because my wife and I won't have a fit if we miss a meeting. I installed 5.0 and they've changed from Tomcat to Jetty, which is nice, but you still can't bind Zimbra to a single IP without hacking up all the conf files and putting some changes in LDAP. In fact, I had to change my hostname(1) during install temporarily just to get it on the right track. Then I went around hacking up the files to keep it from trying to hog the entire machine.
Of course, Zimbra will tell you that you need to dedicate the whole machine to ZCS. You would think the fact that it uses so many open source components means you could hack on it, but in reality most of your changes will be lost each time you upgrade and you will need to re-apply them (we do exactly that for Mailman integration). Until they get more of the config into the LDAP server, that's just what you're going to have to live with. I guess the fact that is OSS means that's at least an option.
On the plus side, it does have some nice Gee Whiz factor to it and we are talking about setting up a Zimbra server at a remote office that shares the same config as our current one and it's supposed to be very easy, but as with everything else, the devil is probably in the details. Like I said, I'm still planning on running it for my personal stuff, so I don't hate it as much as I might have come across. I don't know if I'd want to run it at my business again, except for the fact that there really is no one else who comes close.
(except Exchange, but we're not an MS-only shop, and please don't give me any of that it runs IMAP garbage, because we all know that's not a real solution)
Cheers, -Dave Posted by Dave Mangot in Applications at 20080207
Friday November 02, 2007
Worlds collide: RMI vs. Linux localhost
A few times in my career as a Unix sysadmin working with Java applications I've into situations that use RMI remotely, and each time there have been problems. The two most recent that come to mind are jstatd and the Terracotta admin console.
Because I now work at Terracotta, I've had a chance to actually do some testing to find out where the problem arises. We've seen this come up numerous times on our Forums, so much so that my buddy Gary who explained much of the what is going on "behind the scenes" has changed our default behavior in recent versions of the software.
When clients connect to the RMI server, the server returns the address of the JMX server to query to get our statistics. On clients where hostname(1) is set to localhost, that is what gets returned. Of course, when the client is told to connect to localhost by the remote server, it fails because the JMX server is really remote. Turns out this is a pretty common problem in the Java world. You can find many examples of users complaining about it in Sun Java Forums.
When it works
To get the Terracotta server to use the RMI stub, we have to put it into authentication mode. Details on how to do this can be found in the Terracotta Configuration Guide
To actually see what is going wrong, first we'll look at a situation where it works correctly.
First we take a tcpdump of the client connecting to the server where the server actually has its hostname mapped correctly to its externally accessible IP address. We feed it into Wireshark (security holes be damned!) and do a Follow TCP Stream.
Here we can see that the RMI server has returned the IP address of the machine on which it runs.
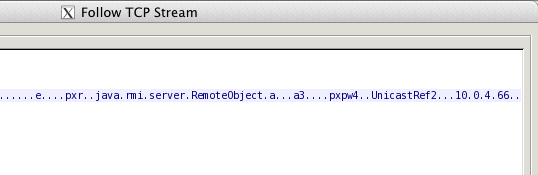
When it fails
Next we change the hostname to localhost. We then do a Follow TCP Stream and see this:
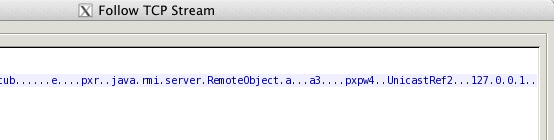
The RMI server has returned 127.0.0.1 (localhost) to our remote client, and we get connection failed on the client.
Why are the hostnames of these machines being set to localhost?
I think what is happening is many of our users are testing out Terracotta on their desktops, or machines that have been built from the install CDs. When this happens, Linux is assuming that those machines will receive an IP address via DHCP. If that's the case, they don't want to hard code an IP into /etc/hosts. Therefore the only entry in /etc/hosts winds up being localhost and the hostname is set to the same. We see this kind of behavior to varying degrees even with our automated installs. Our kickstarts and autoyasts tend to put the correct name, hostname, and IP address information into /etc/hosts presumably pulling the address from DHCP. If there is no DHCP entry for a host, autoyast will put an entry with 127.0.0.2 in /etc/hosts, weird.
Posted by Dave Mangot in Applications at 20071102 Comments[1]Search This Site
Recent Entries
- DevOpsDays 2012: "Event Detection" Open Space
- DevOpsDays 2012: "Logging" Open Space
- Ode to the External Node Classifier (ENC)
- I'm speaking at Velocity 2012!
- Host-based sFlow: a drop-in cloud-friendly monitoring standard
- Graphite as presented to the LSPE Meetup 16 June 2011
- The Graphite CLI
- Back on the Blog Gang
- A framework for running anything on EC2: Terracotta tests on the Cloud - Part 1
- A Trade Show Booth: Part 2 - The Puppet Config
- Intstalling Fedora 10 on a Mac Mini
- A Trade Show booth with PF and OpenBSD
- EC2 Variability: The numbers revealed
- Linksys WET54G, a consumer product?
- Choosing Zimbra as told to ex-Taosers@groups.yahoo
- Information Security Magazine Chuckle
- A SysAdmin's impressions of MacOS Leopard
- Worlds collide: RMI vs. Linux localhost
- Hello World